Cup and Handle Pattern
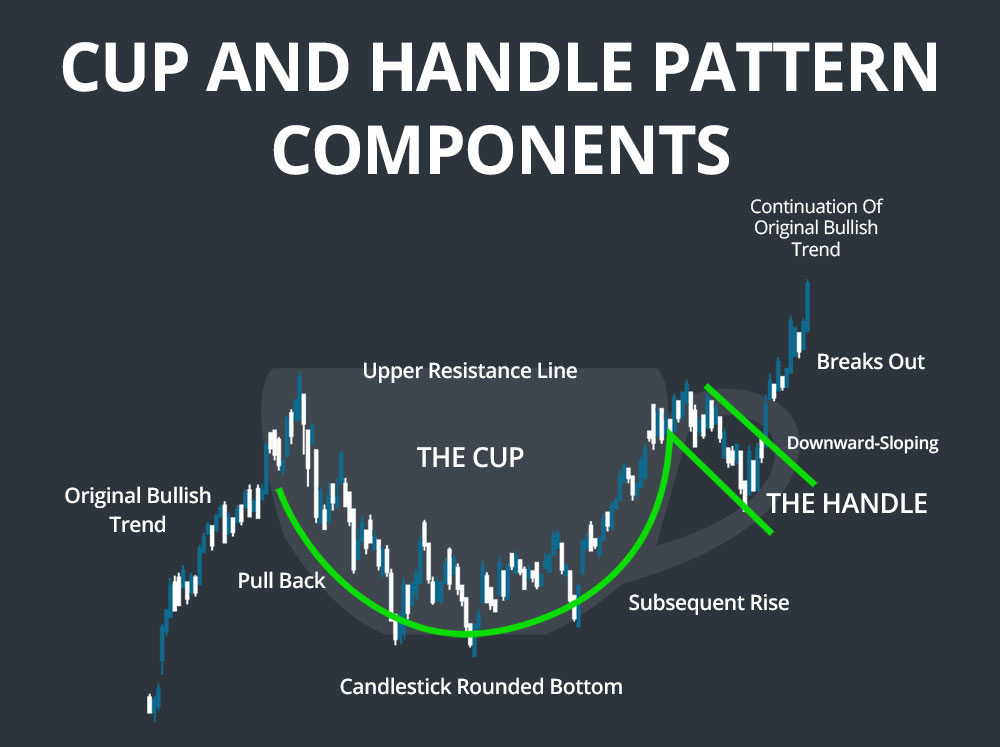
The Cup and Handle pattern is a bullish continuation pattern that is used by traders to identify potential upward trends in the market. This pattern resembles a cup and handle on a chart, with the cup forming when the price of an asset falls, and the handle forming when the price moves up again. This pattern is formed when the price of an asset reaches its lowest point and is ready to start a new uptrend.
To identify the Cup and Handle pattern, traders look for a U-shaped pattern on the chart followed by a small consolidation period. The handle then forms as the price rises again, usually with lower volume, before the asset breaks out to a new high.
To read more more details: https://scanz.com/cup-and-handle-patterns/
Ascending Triangle Pattern
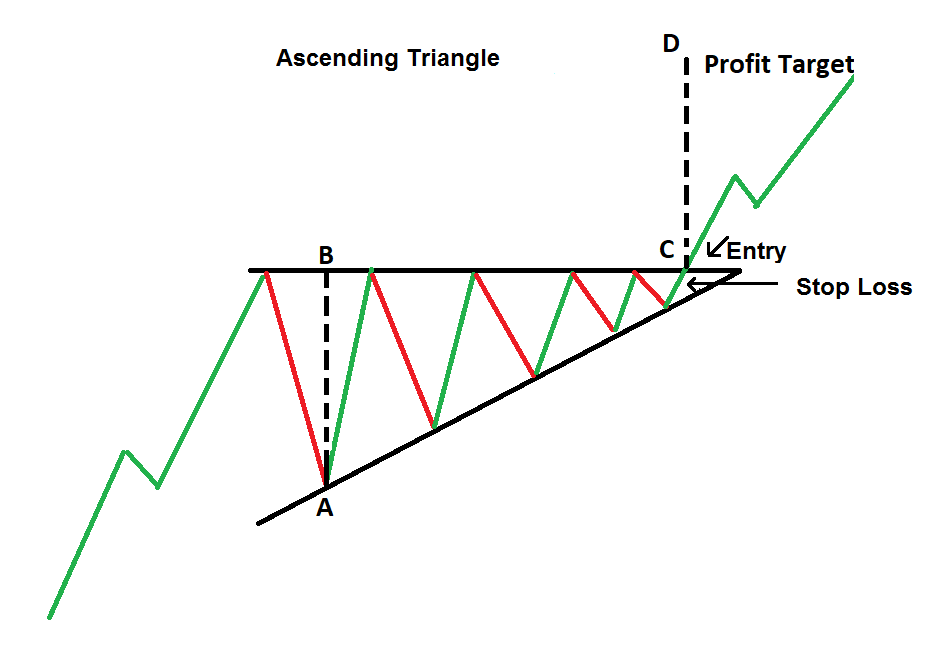
The Ascending Triangle pattern is a bullish pattern that forms when the price of an asset moves up to form a horizontal resistance level while forming higher lows. This pattern is often seen as a sign of bullish sentiment and is used by traders to anticipate a potential upward breakout.
To identify the Ascending Triangle pattern, traders look for an asset that has formed a series of higher lows while the resistance level remains flat. This indicates that buyers are slowly gaining control of the market, and a breakout above the resistance level is likely to occur.
To read more more details: https://investarindia.com/blog/ascending-and-descending-triangle-chart-patterns/
Bullish Flag Pattern
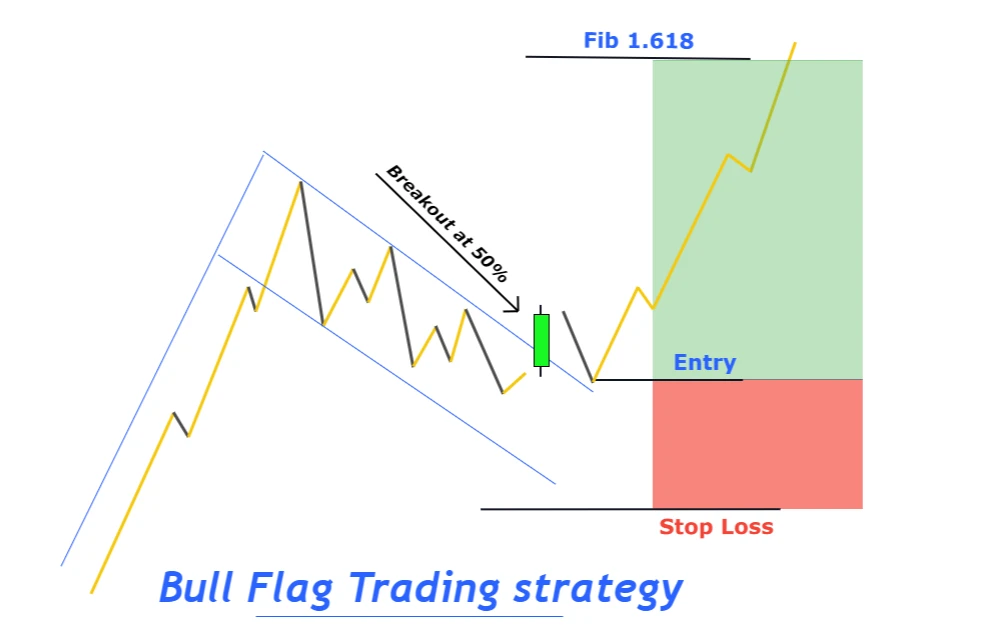
The Bullish Flag pattern is a continuation pattern that forms after a sharp price increase. It is a bullish signal that suggests a short-term pause in the uptrend before continuing upward.
To identify the Bullish Flag pattern, traders look for a rapid price increase followed by a short consolidation period, which forms the flag. This consolidation usually occurs at a price level slightly below the peak, indicating that the market is still bullish. The continuation of the uptrend is usually confirmed when the asset breaks above the flag pattern.
To read more more details: https://forexbee.co/bull-flag-pattern/
Inverse Head and Shoulders Pattern
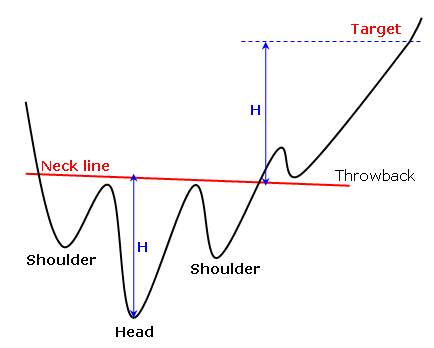
The Inverse Head and Shoulders pattern is a reversal pattern that signals a potential trend reversal from a bearish to a bullish trend. It is formed by three troughs, with the middle trough being the lowest and the outside troughs being slightly higher.
To identify the Inverse Head and Shoulders pattern, traders look for three troughs on the chart, with the middle trough being the lowest. The outside troughs are slightly higher and form the shoulders, while the middle trough forms the head. The pattern is completed when the asset breaks above the neckline, which is formed by connecting the two shoulders.
To read more more details: https://www.personalfinancelab.com/advanced/reverse-head-and-shoulders/
Bullish Divergence Pattern
The Bullish Divergence pattern is a momentum indicator that signals a potential bullish trend reversal. It is formed when the price of a stock is moving down, but the indicators that measure momentum (such as RSI or MACD) are moving up. This is seen as a bullish signal, indicating that the downtrend may soon reverse.
To identify the Bullish Divergence pattern, traders look for a divergence between the price of an asset and a momentum indicator. For example, if the price of the asset is trending down, but the RSI is trending up, this could indicate a potential reversal. Traders look for confirmation of the reversal by waiting for the price to break above a resistance level.
In conclusion, these are the top 5 bullish market patterns that traders often look for as potential indicators of an upcoming uptrend in the market. However, it is important to note that no trading strategy is foolproof, and traders should always exercise caution and use appropriate risk management techniques when trading.
To read more more details: https://www.thinkmarkets.com/en/learn-to-trade/indicators-and-patterns/general-patterns/what-is-bullish-and-bearish-divergence/
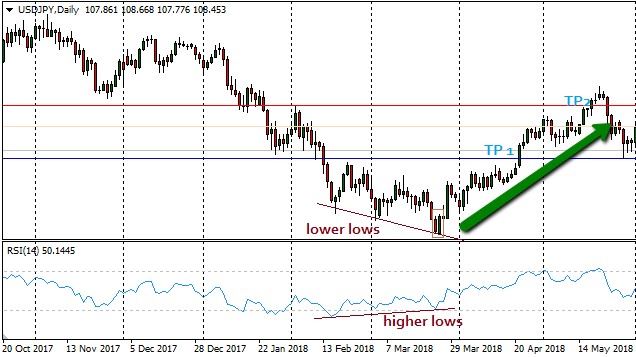
Hidden Bullish Divergence

Hidden Bullish Divergence is a bullish trend continuation pattern that occurs when the price of an asset is in an uptrend and pulls back before continuing the upward trend. This pattern is similar to the regular bullish divergence pattern, but it occurs during a price correction within an uptrend.
The hidden bullish divergence pattern occurs when the price of an asset makes a lower low, while the oscillator indicator (such as RSI or MACD) makes a higher low. This indicates that the price correction is losing momentum, and the upward trend is likely to continue.
Traders look for the hidden bullish divergence pattern as it is a signal to enter a long position or add to an existing position in an uptrend. However, as with any trading strategy, it is important to use appropriate risk management techniques and consider other factors such as market sentiment, news, and economic data before making any trading decisions.
To read more more details: